Time Log Teams – Time Spent on Other Teams’ Sites
Date: Mar. 01, 2026 From: 05:20 pm To: 05:55 pm
Date: Mar. 03, 2026 From: 06:40 pm To: 07:15 pm
Date: Mar. 05, 2026 From: 04:50 pm To: 05:35 pm
Date: Mar. 07, 2026 From: 08:10 pm To: 09:05 pm
Time Log Students – Time Spent on Other Students’ Sites
Date: Mar. 01, 2026 From: 06:10 pm to: 06:45 pm
Date: Mar. 03, 2026 From: 07:35 pm To: 08:05 pm
Date: Mar. 05, 2026 From: 08:15 pm To: 08:40 pm
Date: Mar. 07, 2026 From: 09:30 pm To: 10:20 pm
Summary of activities and new content created
This week I worked on expanding the website by creating new content that targets a general audience while also organizing the site structure for analytics tracking. I added new posts, categorized them properly, and assigned relevant tags to improve navigation and searchability. I also ensured that each new post was linked in both the general menu and the HW section for grading purposes. In addition to publishing content, I reviewed other teams’ and students’ websites to observe their design choices and analytics implementations. The new posts created this week include:
• Plane Spotting Near Seattle–Tacoma International Airport
• Why Watching Sunsets Never Gets Old
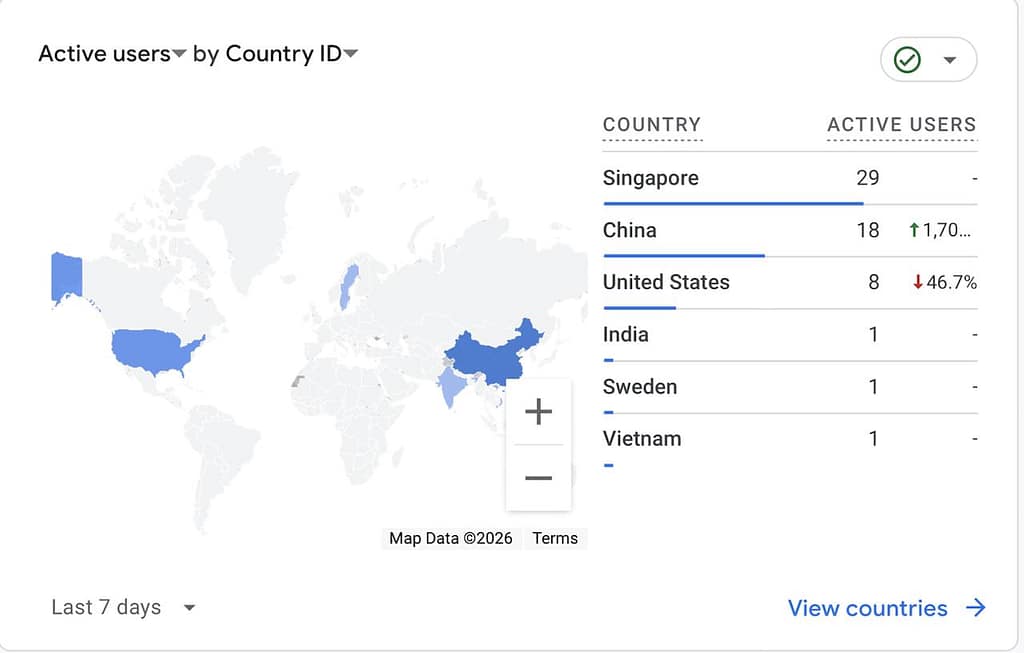
Analysis of Automated Insights
The automated insights generated by Google Analytics highlighted the geographic distribution of users visiting the website. Based on the geo-location dashboard, the majority of users during the last seven days came from Singapore and China, followed by the United States and a few visitors from India, Sweden, and Vietnam. This visualization helps identify where the audience is located and shows how website content may be reaching users globally. Understanding the geographic distribution of users can help guide future content decisions, such as focusing on topics that appeal to international audiences or optimizing posting times based on time zones.
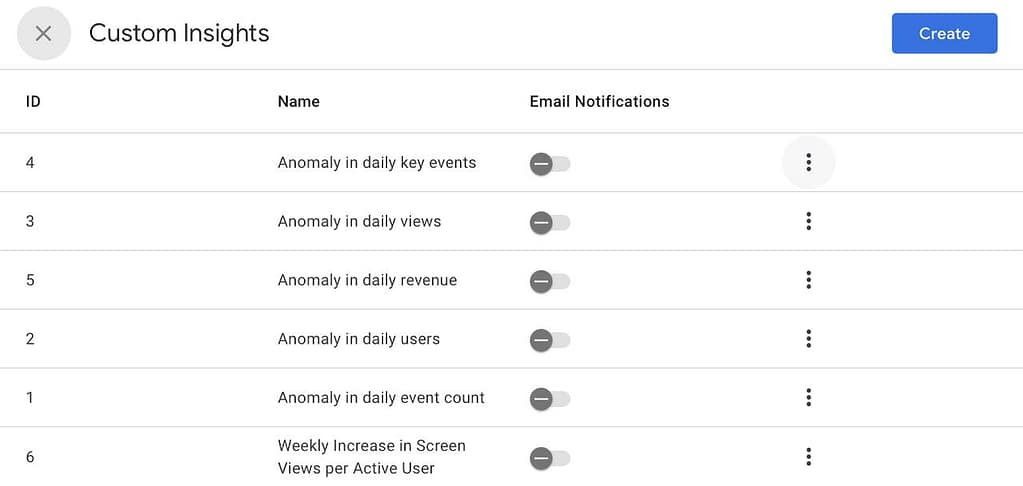
Analysis of Custom Insights
Custom insights were created to monitor unusual changes in key website performance metrics. Several anomaly detection rules were configured to track metrics such as daily key events, daily views, daily revenue, daily users, and daily event counts. These rules allow the analytics system to detect unexpected spikes or drops in activity and alert the website administrator when significant deviations occur. For example, a sudden increase in event counts or views may indicate that a specific post or page is gaining traction, while a drop in users could suggest lower engagement. These custom insights help proactively monitor the website’s performance and quickly identify meaningful trends in user behavior.
About Me Agent Airbus Application AWS Boeing Career Chennai Cloud Computing CMS Containers Course Data Science Destinations Docker Education Energy Football GA4 Google Analytics Hobbies Hometown HW Interests Lifestyle MLS Navigation Night Northern Lights OpenAI Personal Plane Spotting Professional Rain Seattle Simulation Summary Sunset Tags Travel Virtual Servers Web Development Windmill WordPress World
0 Comments