Time Log Teams – time spent on other Teams’ sites
Date: Mar. 08, 2026 From: 06:10 pm To: 06:45 pm
Date: Mar. 09, 2026 From: 07:15 pm To: 07:50 pm
Date: Mar. 10, 2026 From: 05:40 pm To: 06:20 pm
Date: Mar. 11, 2026 From: 08:05 pm To: 08:50 pm
Time Log Students – time spent on other students’ sites
Date: Mar. 08, 2026 From: 07:05 pm To: 07:35 pm
Date: Mar. 09, 2026 From: 08:10 pm To: 08:40 pm
Date: Mar. 10, 2026 From: 09:00 pm To: 09:25 pm
Date: Mar. 12, 2026 From: 06:30 pm To: 07:05 pm
Summary of Activities and New Contents
This week I focused on expanding the content on my personal website by creating new posts and improving engagement features. I added new articles that include images with proper citations and ensured that the comment section is enabled so visitors can share their thoughts and interact with the content. The goal of these posts is to provide interesting topics that may attract visitors and encourage engagement on the site. One of the posts explores the science and beauty of the Northern Lights and why they have been visible more frequently in recent years. Another post discusses the growing global shift toward renewable energy and why many countries are investing in solar and wind power. These additions help make the site more informative while also providing more data for analytics tracking in my dashboard. The new content created this week can be accessed through the following links:
Summary of your KPI Table
The KPI table was created to track the overall performance of my personal website by focusing on two main goals: increasing website traffic and improving user engagement. For traffic growth, the main indicators include audience reach and traffic trends, measured using metrics such as views, users, and sessions. For engagement, the indicators focus on how visitors interact with the content, which is measured using metrics like average session duration, engagement rate, and page views for top pages. Additional indicators such as traffic sources help identify how visitors are discovering the site. Together, these KPIs provide a simple way to understand whether the website is attracting visitors and whether those visitors are meaningfully interacting with the content.
| Goal | KPI (Indicator) | Chart / Visualization | Metrics |
|---|---|---|---|
| Increase website traffic | Audience reach | Scorecard | Views, Users, Sessions |
| Increase website traffic | Traffic growth over time | Time series chart (Traffic trend) | Views by Date |
| Improve visitor engagement | User interaction with content | Scorecard | Average Session Duration, Engagement Rate |
| Improve content performance | Most viewed pages | Table (Top pages chart) | Page Title, Views, Active Users, Avg Engagement Time |
| Understand traffic acquisition | Visitor source analysis | Pie chart (Traffic Source Chart) | Sessions by Default Channel Group (Direct, Referral, Organic Search) |
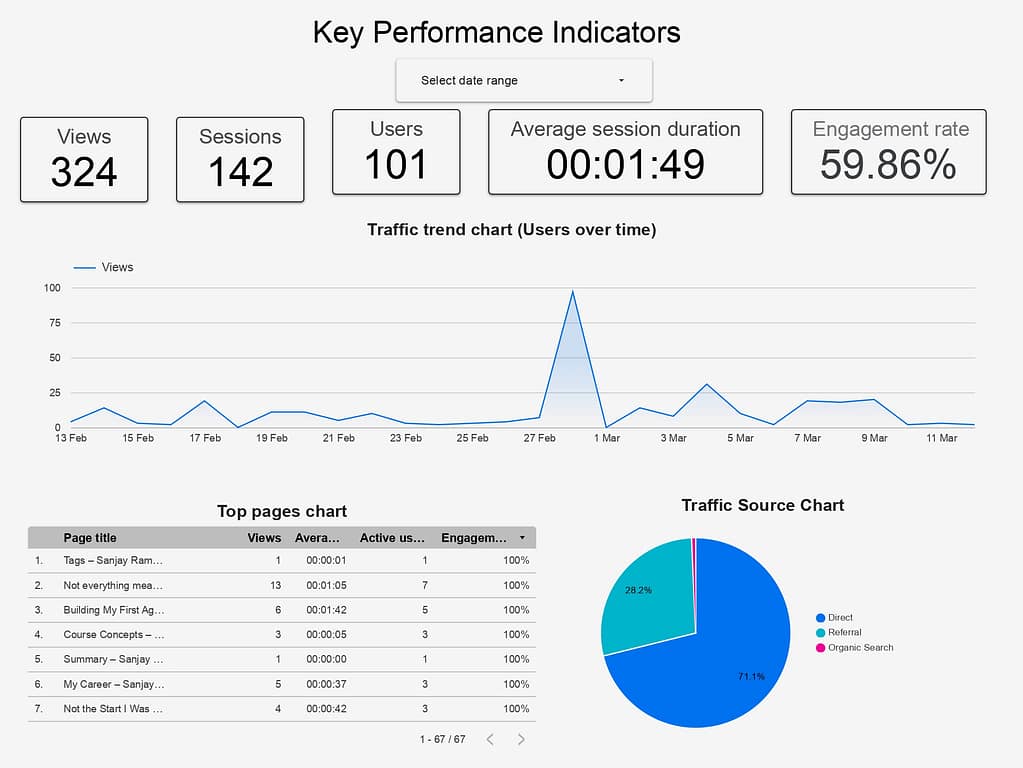
Summary of your Looker Studio Report with KPI Identified
The Looker Studio report was designed to present the key performance indicators of the website in a clear and easy to interpret dashboard format. The top section highlights important KPIs such as views, sessions, users, average session duration, and engagement rate, which give a quick overview of the site’s performance. The traffic trend chart shows how user activity changes over time, helping identify spikes or drops in traffic. The top pages table highlights which pages receive the most views and engagement, indicating what content resonates with visitors. Finally, the traffic source chart shows where visitors are coming from, such as direct visits, referrals, or organic search, helping understand how people discover the website. Together, these visuals provide a clear picture of both traffic and engagement on the site.
About Me Agent Airbus Application AWS Boeing Career Chennai Cloud Computing CMS Containers Course Data Science Destinations Docker Education Energy Football GA4 Google Analytics Hobbies Hometown HW Interests Lifestyle MLS Navigation Night Northern Lights OpenAI Personal Plane Spotting Professional Rain Seattle Simulation Summary Sunset Tags Travel Virtual Servers Web Development Windmill WordPress World
0 Comments